


Celina CCD, Collin County, Texas
About
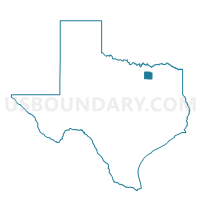
Outline

Summary
| Unique Area Identifier | 154493 |
| Name | Celina CCD |
| County | Collin County |
| State | Texas |
| Area (square miles) | 112.37 |
| Land Area (square miles) | 110.79 |
| Water Area (square miles) | 1.58 |
| % of Land Area | 98.59 |
| % of Water Area | 1.41 |
| Latitude of the Internal Point | 33.30125980 |
| Longtitude of the Internal Point | -96.75772390 |
| Total Population | 20,403 |
| Total Housing Units | 7,257 |
| Total Households | 6,508 |
| Median Age | 34.7 |
Maps

Graphs
Select a template below for downloading or customizing gragh for Celina CCD, Collin County, Texas


Neighbors
Neighoring County Subdivision (by Name) Neighboring County Subdivision on the Map
- Anna CCD, Collin County, TX
- McKinney CCD, Collin County, TX
- Pilot Point-Aubrey CCD, Denton County, TX
- Southwest Grayson CCD, Grayson County, TX
Top 10 Neighboring Place (by Population) Neighboring Place on the Map
- McKinney city, TX (131,117)
- Frisco city, TX (116,989)
- Prosper town, TX (9,423)
- Celina city, TX (6,028)
- Pilot Point city, TX (3,856)
- Gunter city, TX (1,498)
- Weston city, TX (563)
Top 10 Neighboring Unified School District (by Population) Neighboring Unified School District on the Map
- Frisco Independent School District, TX (163,063)
- McKinney Independent School District, TX (111,017)
- Prosper Independent School District, TX (15,951)
- Celina Independent School District, TX (8,828)
- Pilot Point Independent School District, TX (8,041)
- Gunter Independent School District, TX (2,955)
Top 10 Neighboring State Legislative District Lower Chamber (by Population) Neighboring State Legislative District Lower Chamber on the Map
- State House District 70, TX (300,801)
- State House District 89, TX (253,976)
- State House District 65, TX (224,883)
- State House District 63, TX (218,386)
- State House District 62, TX (154,792)
Top 10 Neighboring State Legislative District Upper Chamber (by Population) Neighboring State Legislative District Upper Chamber on the Map
- State Senate District 12, TX (1,013,641)
- State Senate District 8, TX (940,963)
- State Senate District 30, TX (823,594)
Top 10 Neighboring 111th Congressional District (by Population) Neighboring 111th Congressional District on the Map
- Congressional District 26, TX (915,137)
- Congressional District 4, TX (846,142)
- Congressional District 3, TX (842,449)
Top 10 Neighboring Census Tract (by Population) Neighboring Census Tract on the Map
- Census Tract 19, Grayson County, TX (10,515)
- Census Tract 303.05, Collin County, TX (8,391)
- Census Tract 305.26, Collin County, TX (7,247)
- Census Tract 306.05, Collin County, TX (6,293)
- Census Tract 303.03, Collin County, TX (4,642)
- Census Tract 305.27, Collin County, TX (3,747)
- Census Tract 201.04, Denton County, TX (3,216)
- Census Tract 306.04, Collin County, TX (3,009)
- Census Tract 303.01, Collin County, TX (2,874)
- Census Tract 303.04, Collin County, TX (2,468)
Top 10 Neighboring 5-Digit ZIP Code Tabulation Area (by Population) Neighboring 5-Digit ZIP Code Tabulation Area on the Map
- 75034, TX (72,723)
- 75071, TX (36,090)
- 75078, TX (10,592)
- 75009, TX (8,785)
- 76258, TX (6,659)
- 75058, TX (2,982)
Data
Demographic, Population, Households, and Housing Units
** Data sources from census 2010 **
Show Data on Map
Download Full List as CSV
Download Quick Sheet as CSV
| Subject | This Area | Collin County | Texas | National |
|---|---|---|---|---|
| POPULATION | ||||
| Total Population Map | 20,403 | 782,341 | 25,145,561 | 308,745,538 |
| POPULATION, HISPANIC OR LATINO ORIGIN | ||||
| Not Hispanic or Latino Map | 17,584 | 666,987 | 15,684,640 | 258,267,944 |
| Hispanic or Latino Map | 2,819 | 115,354 | 9,460,921 | 50,477,594 |
| POPULATION, RACE | ||||
| White alone Map | 17,693 | 560,036 | 17,701,552 | 223,553,265 |
| Black or African American alone Map | 1,029 | 66,387 | 2,979,598 | 38,929,319 |
| American Indian and Alaska Native alone Map | 169 | 4,448 | 170,972 | 2,932,248 |
| Asian alone Map | 303 | 87,752 | 964,596 | 14,674,252 |
| Native Hawaiian and Other Pacific Islander alone Map | 7 | 448 | 21,656 | 540,013 |
| Some Other Race alone Map | 747 | 40,087 | 2,628,186 | 19,107,368 |
| Two or More Races Map | 455 | 23,183 | 679,001 | 9,009,073 |
| POPULATION, SEX | ||||
| Male Map | 10,145 | 384,363 | 12,472,280 | 151,781,326 |
| Female Map | 10,258 | 397,978 | 12,673,281 | 156,964,212 |
| POPULATION, AGE (18 YEARS) | ||||
| 18 years and over Map | 13,605 | 557,664 | 18,279,737 | 234,564,071 |
| Under 18 years | 6,798 | 224,677 | 6,865,824 | 74,181,467 |
| POPULATION, AGE | ||||
| Under 5 years | 1,654 | 58,849 | 1,928,473 | 20,201,362 |
| 5 to 9 years | 2,081 | 66,143 | 1,928,234 | 20,348,657 |
| 10 to 14 years | 2,047 | 64,240 | 1,881,883 | 20,677,194 |
| 15 to 17 years | 1,016 | 35,445 | 1,127,234 | 12,954,254 |
| 18 and 19 years | 415 | 17,869 | 755,890 | 9,086,089 |
| 20 years | 181 | 7,499 | 369,040 | 4,519,129 |
| 21 years | 156 | 7,069 | 359,015 | 4,354,294 |
| 22 to 24 years | 451 | 24,211 | 1,089,024 | 12,712,576 |
| 25 to 29 years | 974 | 50,723 | 1,853,039 | 21,101,849 |
| 30 to 34 years | 1,323 | 59,072 | 1,760,434 | 19,962,099 |
| 35 to 39 years | 1,811 | 69,084 | 1,763,587 | 20,179,642 |
| 40 to 44 years | 1,916 | 66,823 | 1,694,795 | 20,890,964 |
| 45 to 49 years | 1,731 | 65,732 | 1,760,467 | 22,708,591 |
| 50 to 54 years | 1,331 | 53,370 | 1,674,869 | 22,298,125 |
| 55 to 59 years | 995 | 41,588 | 1,422,924 | 19,664,805 |
| 60 and 61 years | 368 | 14,476 | 500,523 | 7,113,727 |
| 62 to 64 years | 440 | 20,100 | 674,244 | 9,704,197 |
| 65 and 66 years | 277 | 10,269 | 373,062 | 5,319,902 |
| 67 to 69 years | 336 | 13,093 | 480,038 | 7,115,361 |
| 70 to 74 years | 383 | 14,958 | 619,156 | 9,278,166 |
| 75 to 79 years | 227 | 9,647 | 477,245 | 7,317,795 |
| 80 to 84 years | 127 | 6,310 | 347,206 | 5,743,327 |
| 85 years and over | 163 | 5,771 | 305,179 | 5,493,433 |
| MEDIAN AGE BY SEX | ||||
| Both sexes Map | 34.70 | 35.00 | 33.60 | 37.20 |
| Male Map | 34.20 | 34.30 | 32.60 | 35.80 |
| Female Map | 35.10 | 35.60 | 34.60 | 38.50 |
| HOUSEHOLDS | ||||
| Total Households Map | 6,508 | 283,759 | 8,922,933 | 116,716,292 |
| HOUSEHOLDS, HOUSEHOLD TYPE | ||||
| Family households: Map | 5,496 | 206,793 | 6,237,148 | 77,538,296 |
| Husband-wife family Map | 4,792 | 168,730 | 4,515,013 | 56,510,377 |
| Other family: Map | 704 | 38,063 | 1,722,135 | 21,027,919 |
| Male householder, no wife present Map | 230 | 10,809 | 467,431 | 5,777,570 |
| Female householder, no husband present Map | 474 | 27,254 | 1,254,704 | 15,250,349 |
| Nonfamily households: Map | 1,012 | 76,966 | 2,685,785 | 39,177,996 |
| Householder living alone Map | 798 | 62,352 | 2,163,266 | 31,204,909 |
| Householder not living alone Map | 214 | 14,614 | 522,519 | 7,973,087 |
| HOUSEHOLDS, HISPANIC OR LATINO ORIGIN OF HOUSEHOLDER | ||||
| Not Hispanic or Latino householder: Map | 5,855 | 253,269 | 6,308,776 | 103,254,926 |
| Hispanic or Latino householder: Map | 653 | 30,490 | 2,614,157 | 13,461,366 |
| HOUSEHOLDS, RACE OF HOUSEHOLDER | ||||
| Householder who is White alone | 5,777 | 214,009 | 6,570,152 | 89,754,352 |
| Householder who is Black or African American alone | 335 | 24,951 | 1,088,836 | 14,129,983 |
| Householder who is American Indian and Alaska Native alone | 47 | 1,495 | 57,265 | 939,707 |
| Householder who is Asian alone | 85 | 27,069 | 307,373 | 4,632,164 |
| Householder who is Native Hawaiian and Other Pacific Islander alone | 1 | 140 | 6,353 | 143,932 |
| Householder who is Some Other Race alone | 171 | 10,504 | 714,396 | 4,916,427 |
| Householder who is Two or More Races | 92 | 5,591 | 178,558 | 2,199,727 |
| HOUSEHOLDS, HOUSEHOLD TYPE BY HOUSEHOLD SIZE | ||||
| Family households: Map | 5,496 | 206,793 | 6,237,148 | 77,538,296 |
| 2-person household Map | 1,771 | 74,239 | 2,283,002 | 31,882,616 |
| 3-person household Map | 1,185 | 48,786 | 1,417,977 | 17,765,829 |
| 4-person household Map | 1,420 | 50,322 | 1,286,463 | 15,214,075 |
| 5-person household Map | 740 | 21,532 | 709,450 | 7,411,997 |
| 6-person household Map | 237 | 7,633 | 307,995 | 3,026,278 |
| 7-or-more-person household Map | 143 | 4,281 | 232,261 | 2,237,501 |
| Nonfamily households: Map | 1,012 | 76,966 | 2,685,785 | 39,177,996 |
| 1-person household Map | 798 | 62,352 | 2,163,266 | 31,204,909 |
| 2-person household Map | 170 | 12,160 | 420,415 | 6,360,012 |
| 3-person household Map | 27 | 1,551 | 64,352 | 992,156 |
| 4-person household Map | 9 | 646 | 26,532 | 411,171 |
| 5-person household Map | 5 | 155 | 6,926 | 126,634 |
| 6-person household Map | 2 | 53 | 2,610 | 48,421 |
| 7-or-more-person household Map | 1 | 49 | 1,684 | 34,693 |
| HOUSING UNITS | ||||
| Total Housing Units Map | 7,257 | 300,960 | 9,977,436 | 131,704,730 |
| HOUSING UNITS, OCCUPANCY STATUS | ||||
| Occupied Map | 6,508 | 283,759 | 8,922,933 | 116,716,292 |
| Vacant Map | 749 | 17,201 | 1,054,503 | 14,988,438 |
| HOUSING UNITS, OCCUPIED, TENURE | ||||
| Owned with a mortgage or a loan Map | 4,413 | 160,062 | 3,728,987 | 52,979,430 |
| Owned free and clear Map | 873 | 32,981 | 1,956,366 | 23,006,644 |
| Renter occupied Map | 1,222 | 90,716 | 3,237,580 | 40,730,218 |
| HOUSING UNITS, VACANT, VACANCY STATUS | ||||
| For rent Map | 313 | 9,039 | 394,310 | 4,137,567 |
| Rented, not occupied Map | 11 | 435 | 16,509 | 206,825 |
| For sale only Map | 218 | 3,522 | 121,430 | 1,896,796 |
| Sold, not occupied Map | 50 | 755 | 30,437 | 421,032 |
| For seasonal, recreational, or occasional use Map | 58 | 992 | 208,733 | 4,649,298 |
| For migrant workers Map | 0 | 10 | 2,209 | 24,161 |
| Other vacant Map | 99 | 2,448 | 280,875 | 3,652,759 |
| HOUSING UNITS, OCCUPIED, AVERAGE HOUSEHOLD SIZE BY TENURE | ||||
| Total: Map | 3.12 | 2.74 | 2.75 | 2.58 |
| Owner occupied Map | 3.15 | 2.96 | 2.87 | 2.65 |
| Renter occupied Map | 2.99 | 2.28 | 2.54 | 2.44 |
| HOUSING UNITS, OCCUPIED, TENURE BY RACE OF HOUSEHOLDER | ||||
| Owner occupied: Map | 5,286 | 193,043 | 5,685,353 | 75,986,074 |
| Householder who is White alone Map | 4,792 | 154,135 | 4,517,967 | 63,446,275 |
| Householder who is Black or African American alone Map | 230 | 11,128 | 486,371 | 6,261,464 |
| Householder who is American Indian and Alaska Native alone Map | 31 | 935 | 32,734 | 509,588 |
| Householder who is Asian alone Map | 72 | 19,026 | 190,121 | 2,688,861 |
| Householder who is Native Hawaiian and Other Pacific Islander alone Map | 1 | 69 | 3,003 | 61,911 |
| Householder who is Some Other Race alone Map | 100 | 4,618 | 361,514 | 1,975,817 |
| Householder who is Two or More Races Map | 60 | 3,132 | 93,643 | 1,042,158 |
| Renter occupied: Map | 1,222 | 90,716 | 3,237,580 | 40,730,218 |
| Householder who is White alone Map | 985 | 59,874 | 2,052,185 | 26,308,077 |
| Householder who is Black or African American alone Map | 105 | 13,823 | 602,465 | 7,868,519 |
| Householder who is American Indian and Alaska Native alone Map | 16 | 560 | 24,531 | 430,119 |
| Householder who is Asian alone Map | 13 | 8,043 | 117,252 | 1,943,303 |
| Householder who is Native Hawaiian and Other Pacific Islander alone Map | 0 | 71 | 3,350 | 82,021 |
| Householder who is Some Other Race alone Map | 71 | 5,886 | 352,882 | 2,940,610 |
| Householder who is Two or More Races Map | 32 | 2,459 | 84,915 | 1,157,569 |
| HOUSING UNITS, OCCUPIED, TENURE BY HISPANIC OR LATINO ORIGIN OF HOUSEHOLDER | ||||
| Owner occupied: Map | 5,286 | 193,043 | 5,685,353 | 75,986,074 |
| Not Hispanic or Latino householder Map | 4,877 | 176,887 | 4,175,029 | 69,617,625 |
| Hispanic or Latino householder Map | 409 | 16,156 | 1,510,324 | 6,368,449 |
| Renter occupied: Map | 1,222 | 90,716 | 3,237,580 | 40,730,218 |
| Not Hispanic or Latino householder Map | 978 | 76,382 | 2,133,747 | 33,637,301 |
| Hispanic or Latino householder Map | 244 | 14,334 | 1,103,833 | 7,092,917 |
| HOUSING UNITS, OCCUPIED, TENURE BY HOUSEHOLD SIZE | ||||
| Owner occupied: Map | 5,286 | 193,043 | 5,685,353 | 75,986,074 |
| 1-person household Map | 508 | 26,785 | 1,047,772 | 16,453,569 |
| 2-person household Map | 1,653 | 62,060 | 1,900,981 | 27,618,605 |
| 3-person household Map | 1,004 | 37,137 | 975,846 | 12,517,563 |
| 4-person household Map | 1,229 | 41,022 | 911,187 | 10,998,793 |
| 5-person household Map | 604 | 17,124 | 486,511 | 5,057,765 |
| 6-person household Map | 183 | 5,787 | 207,414 | 1,965,796 |
| 7-or-more-person household Map | 105 | 3,128 | 155,642 | 1,373,983 |
| Renter occupied: Map | 1,222 | 90,716 | 3,237,580 | 40,730,218 |
| 1-person household Map | 290 | 35,567 | 1,115,494 | 14,751,340 |
| 2-person household Map | 288 | 24,339 | 802,436 | 10,624,023 |
| 3-person household Map | 208 | 13,200 | 506,483 | 6,240,422 |
| 4-person household Map | 200 | 9,946 | 401,808 | 4,626,453 |
| 5-person household Map | 141 | 4,563 | 229,865 | 2,480,866 |
| 6-person household Map | 56 | 1,899 | 103,191 | 1,108,903 |
| 7-or-more-person household Map | 39 | 1,202 | 78,303 | 898,211 |
Loading...